BACKGROUND
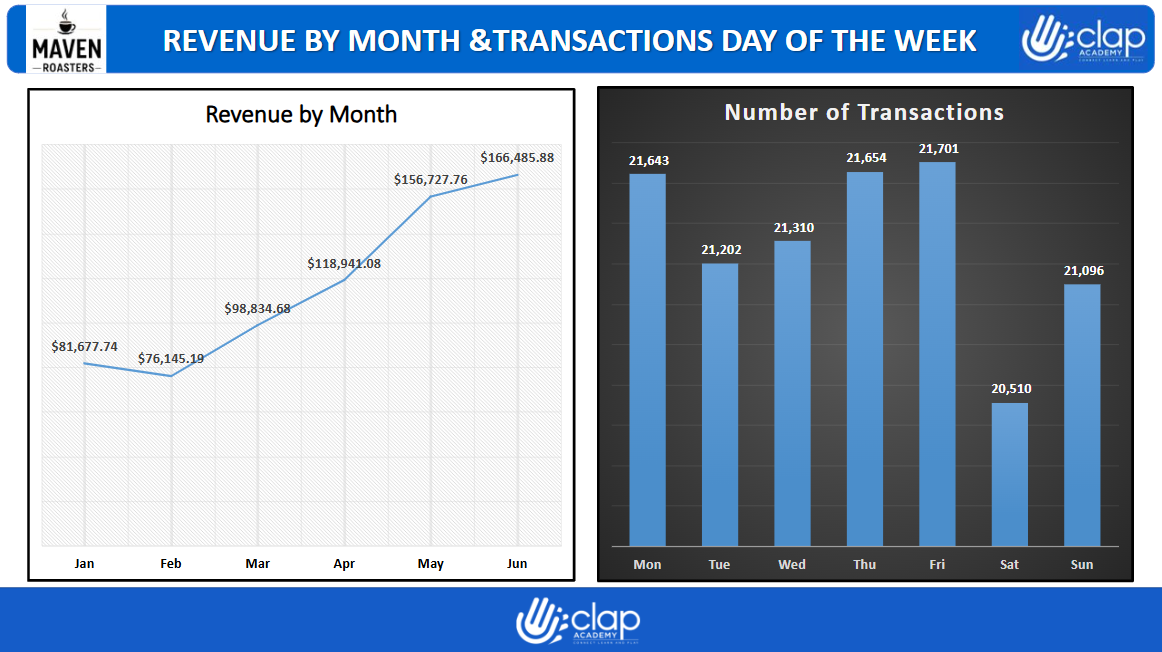
I have been asked to analyze the sales trends at Maven Roasters (the Coffee Shop) across the three locations in New York City. I am to identify the patterns of customers’ transactions, product sales and recommending effective strategies for growing the business. My goal is to transform the data into a dynamic dashboard that the franchise owners can use to uncover trends, optimize operations and identify new business opportunities.
OBJECTIVES
- Cleaning and profiling of sales data
- Building PivotTables to disclose key patterns
- Create an interactive dashboard using Pivot Charts
- And finally, offer business recommendations that will boost the performance
-
DATA CLEANING APPROACH
- I cleaned, organized and structured the data for analysis to ensure its accuracy and relevance using Excel worksheet.
- I also analyzed the data to identify important patterns and trends that can guide decision-making using PivotTables and Charts.
- I designed and created the dashboard that represents the key trends that provide the insights for decision makers


Leave a comment (0 comments)