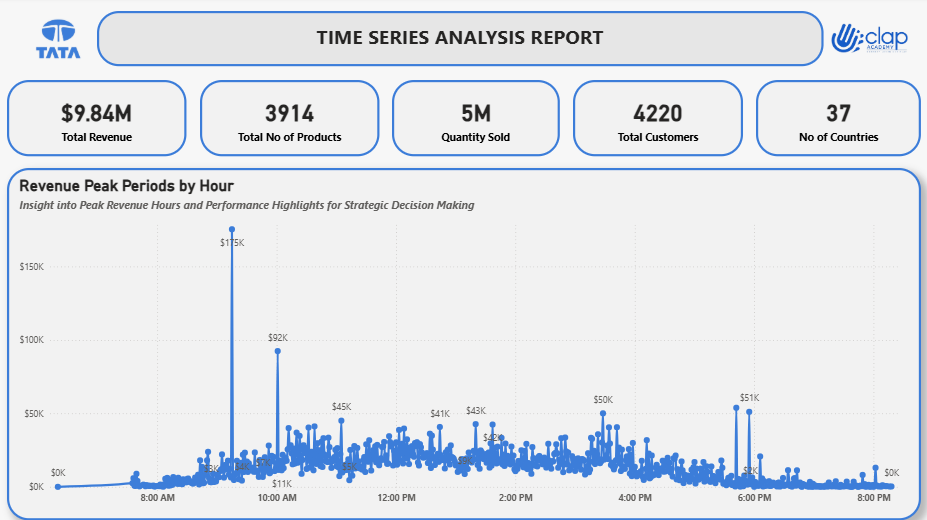
In collaboration with Tata Insights and Quants (TATA IQ),This report delivers a focused analysis of sales and customer data for one of Tata’s online retail businesses, developed in partnership with Tata IQ to support strategic decision-making at the executive level.
Using transaction-level data from 2010–2011, combined with visual analytics through Excel and Power BI, the report uncovers critical patterns in revenue performance, geographic trends, product demand, and customer behavior. Insights are designed to inform next year’s planning, optimize operations, and identify growth opportunities.
Key Areas of Insight
- Seasonal Revenue Trends (CEO)
- To improve forecasting and inventory planning.
- Top-Performing Countries (Ex-UK) (CMO)
- Highlighting high-revenue and high-volume international markets.
- High-Value Customers(CMO)
- Identifying top spenders to guide retention and loyalty strategies.
- Regional Demand & Expansion Opportunities (CEO)
- Spotlighting promising markets outside the UK for strategic growth.
All insights are tailored to support leadership-level decisions, with a strong emphasis on performance optimization, customer engagement, and market expansion.


Leave a comment (0 comments)