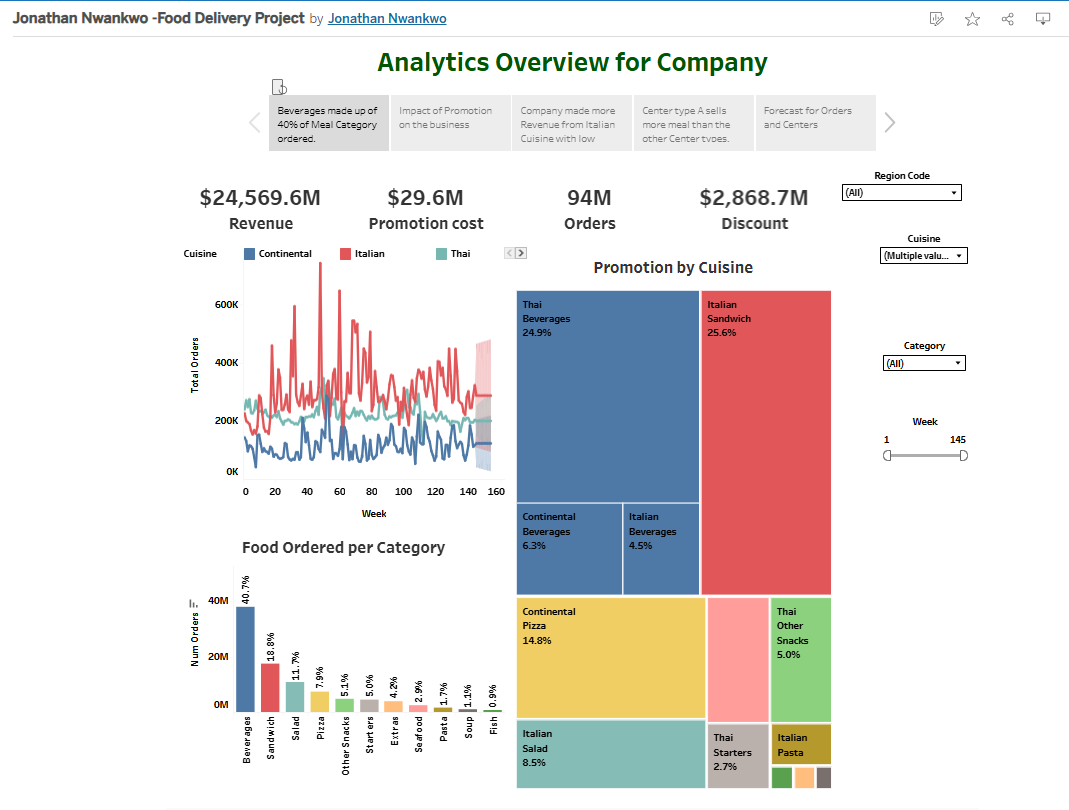
Analytics Overview for Company — Food Delivery Performance Dashboard
Tools: Tableau, Excel
Skills Demonstrated: Data Visualization, Sales Analysis, Promotional ROI Analysis, KPI Reporting
Situation
The company wanted a clear, data-driven view of its food delivery business performance. Leadership needed to understand the relationship between sales, promotions, and customer ordering patterns across different cuisines and categories to guide marketing spend, product focus, and operational decisions.
Task
Design an interactive dashboard that:
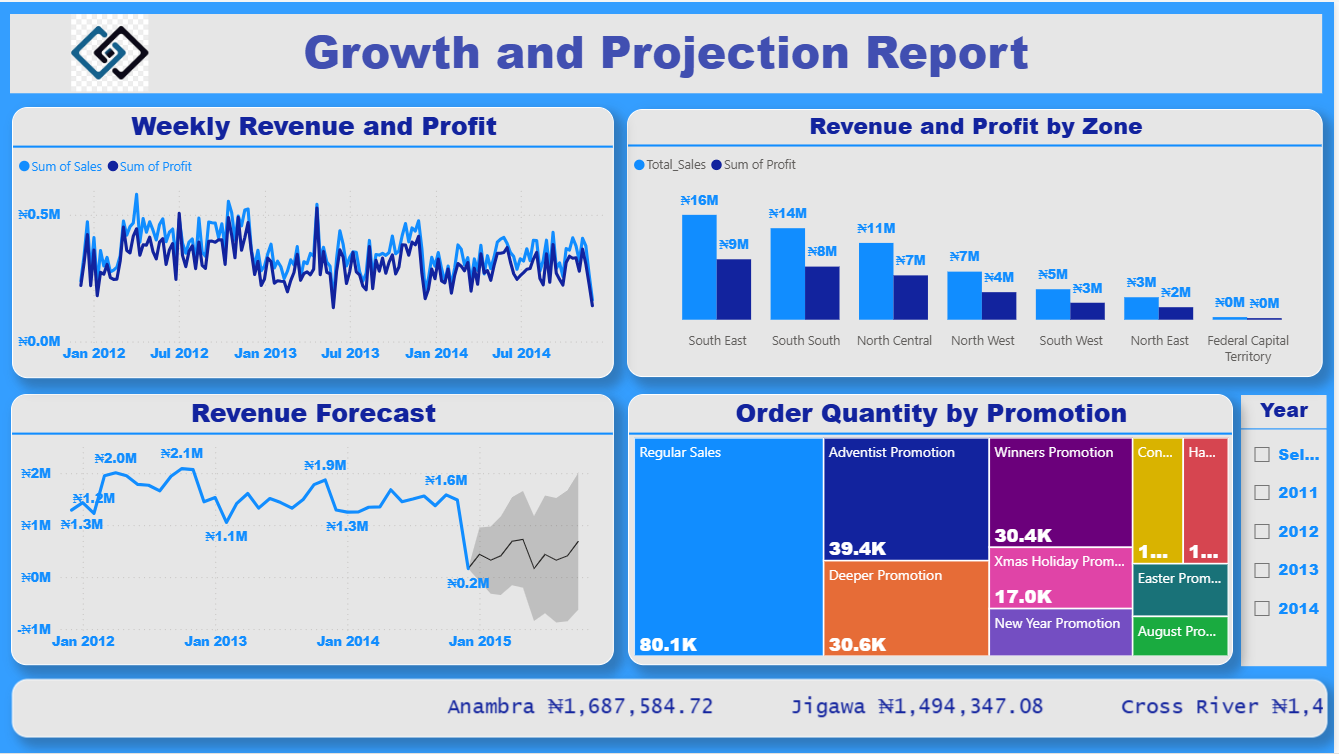
- Consolidates revenue, promotion cost, discount, and order volume into a single view.
- Tracks weekly order trends by cuisine to identify demand patterns.
- Analyzes promotional impact by cuisine and food category.
- Highlights best-selling and underperforming product categories to inform menu and campaign strategy.
Action
- Data Preparation: Cleaned and structured raw order and promotion data in Excel, standardizing cuisine and category fields.
- Dashboard Design in Tableau:
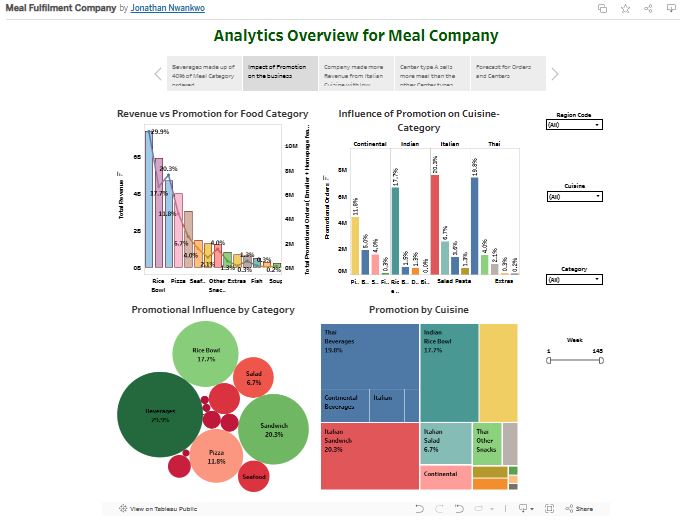
- Created KPI cards for revenue, promotion cost, orders, and discounts for at-a-glance performance.
- Built a weekly orders trend chart segmented by cuisine to track seasonal and promotional spikes.
- Designed a treemap to visualize the distribution of promotions by cuisine and highlight the top beneficiaries.
- Developed a bar chart for “Food Ordered per Category” to rank products by share of orders.
- Integrated interactive filters (Region, Cuisine, Category, Week) to allow customized exploration.
- Analysis: Assessed the contribution of top categories (Beverages, Sandwiches, Pizza) and identified low-performing segments needing marketing intervention.
Result
- Delivered an interactive analytics dashboard that reduced report preparation time for management by over 50%.
- Revealed Beverages as the largest revenue driver (40.7% of total orders), validating promotion spend allocation.
- Identified Italian cuisine as the most responsive to promotions, particularly Italian Sandwiches (25.6% of promotion share).
- Provided insight into seasonal demand peaks, leading to more targeted promotional timing and improved ROI on marketing spend.
- Enabled real-time performance tracking, allowing the marketing team to adjust campaigns on the fly.
Portfolio Value: This project demonstrates my ability to transform operational and promotional data into clear, actionable insights using Tableau. The visual storytelling approach made it easier for decision-makers to see performance gaps, capitalize on high-demand categories, and optimize marketing spend for maximum impact.


Leave a comment (0 comments)