Call Center Dashboard — Customer Service Performance Analysis
Tools: Power BI (or Excel Dashboard), Data Visualization, Sentiment Analysis
Skills Demonstrated: KPI Tracking, Service Performance Analysis, Customer Experience Insights
Situation
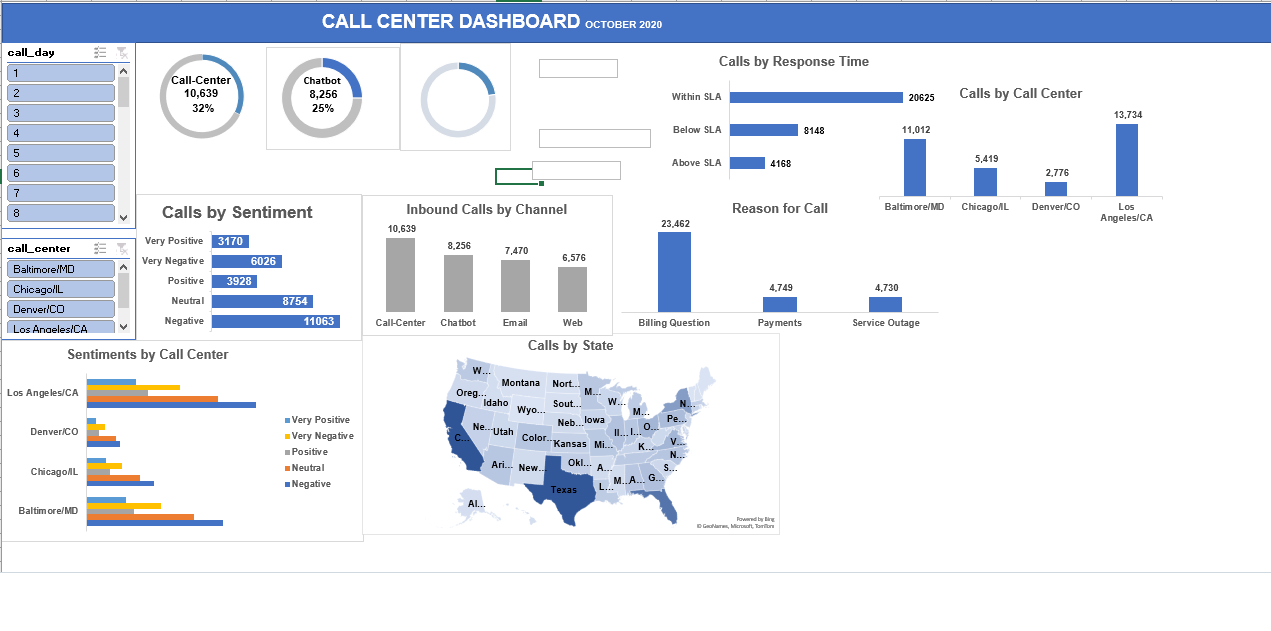
The customer service department needed a centralized, visual tool to monitor call volumes, sentiment trends, and service performance across multiple channels and call centers. Leadership wanted to identify service bottlenecks, improve response times, and address recurring customer issues.
Task
Develop an interactive call center dashboard that:
- Consolidates call volume, sentiment, and response time data across all channels (Call Center, Chatbot, Email, Web).
- Tracks service level adherence (SLA compliance) for timely responses.
- Analyzes call reasons to identify high-impact issues affecting customer satisfaction.
- Breaks down performance by location and sentiment to inform targeted improvement initiatives.
Action
- Data Integration & Cleaning: Merged and cleaned call logs from multiple systems, ensuring consistency in channel, sentiment, and SLA metrics.
- Dashboard Design:
- Created KPI cards for total calls, channel distribution, and SLA compliance.
- Built bar charts for sentiment analysis, call volumes by center, and call reasons.
- Added a map visualization to display calls by state for regional performance insights.
- Included filters for call day and call center for detailed drill-down.
- Analysis:
- Segmented calls into Very Positive, Positive, Neutral, Negative, and Very Negative categories to identify sentiment trends.
- Compared SLA compliance to uncover inefficiencies in service delivery.
- Highlighted top reasons for calls to guide process improvement.
Result
- Delivered a call center performance dashboard that allowed managers to monitor KPIs in real-time, cutting reporting time by over 60%.
- Identified Billing Questions as the dominant call reason (23,462 calls), leading to the implementation of improved self-service billing options.
- Revealed high negative sentiment volume (11,063 calls) and significant very negative cases (6,026 calls), prompting targeted training and quality improvements.
- Found that over 12,000 calls fell outside SLA targets, informing staffing adjustments and escalation procedures.
- Enabled leadership to track channel performance, resulting in increased adoption of chatbots for handling routine inquiries.
Portfolio Value: This project demonstrates my ability to design data-driven operational dashboards that provide actionable insights for improving customer service efficiency, SLA compliance, and customer satisfaction.


Leave a comment (2 comments)